January 2023
Tomasz Woźniak 
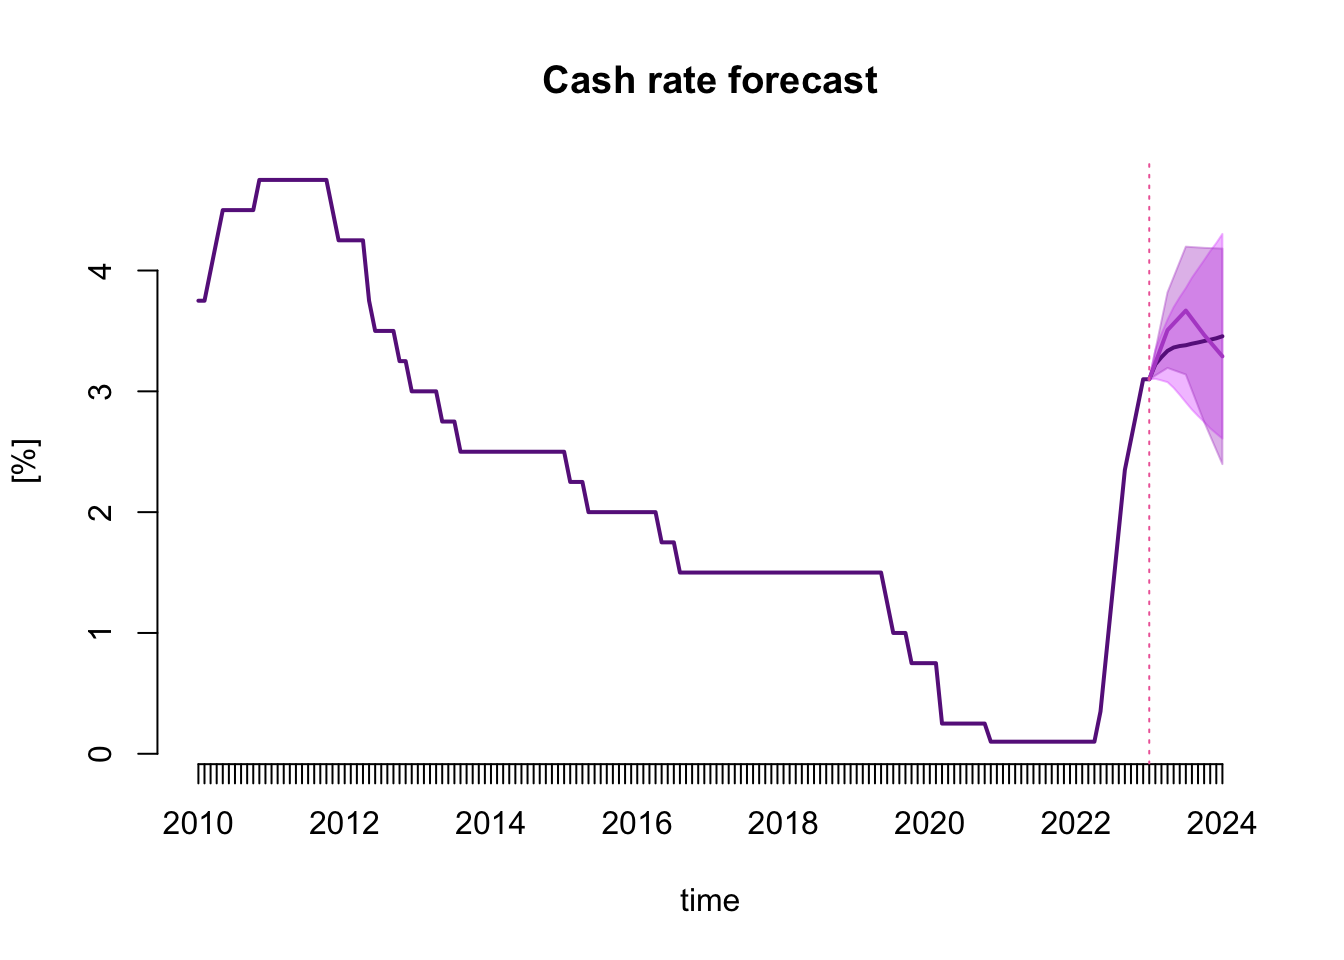
Taking into account the newest data while preparing my answers to the end-of-January RBA cash rate survey by finder.com.au resulted in a noticeable revision of the forecasts. They still indicate the upwards trend in the cash rate value flattening in mid-2023. However, the peak and end-of-the-year cash rate levels are lower than in my November forecasts. Considering predictions using weekly and monthly bond yield data, the peak is not higher than 3.4% in June, with a likely range between 2.9 and 3.9 per cent.
Cash rate forecasts
The figure below presents the monthly cash rate series starting from January 2010, with the forecasts reported from February 2023 to January 2024 as the forecast mean and the 68% forecasting intervals. The forecasts follow a slight upwards trend in cash rate value up to June 2023, reaching the value of 3.4% for the monthly forecast and 3.7% for the quarterly one. After that period, the quarterly forecast goes down, and the monthly flattens. Both met at a value of around 3.5% by the end of 2023.
The data updates from late 2022 and early 2023 led to a noticeable revision of forecasts compared to my November forecasts. As a result, both the peak and the end-of-the-year forecasted values of the cash rate are now at lower levels. In addition, the forecasting intervals narrowed down slightly, with both upper and lower ends having lower values than my previous forecasts.
The table below makes the numerical values presented in the figure more accessible.
| monthly | lower | upper | quarterly | lower | upper | |
|---|---|---|---|---|---|---|
| Feb 2023 | 3.22 | 3.10 | 3.34 | |||
| Mar 2023 | 3.28 | 3.09 | 3.48 | 3.51 | 3.19 | 3.82 |
| Apr 2023 | 3.34 | 3.08 | 3.59 | |||
| May 2023 | 3.36 | 3.03 | 3.70 | |||
| Jun 2023 | 3.37 | 2.97 | 3.78 | 3.67 | 3.14 | 4.20 |
| Jul 2023 | 3.38 | 2.91 | 3.85 | |||
| Aug 2023 | 3.39 | 2.85 | 3.94 | |||
| Sep 2023 | 3.40 | 2.80 | 4.01 | 3.47 | 2.75 | 4.19 |
| Oct 2023 | 3.42 | 2.75 | 4.09 | |||
| Nov 2023 | 3.43 | 2.69 | 4.16 | |||
| Dec 2023 | 3.44 | 2.65 | 4.23 | 3.29 | 2.40 | 4.18 |
| Jan 2024 | 3.46 | 2.61 | 4.30 |
Survey answers
Based on the forecasts above, and the analysis of forecasts from individual models, I formed the following survey answers:
When you think the RBA will change the cash rate?
| Feb 2023 | Mar 2023 | Apr 2023 | May 2023 | Jun 2023 | Jul 2023 | Aug 2023 | Sep 2023 | Oct 2023 | Nov 2023 | Dec 2023 or later | |
|---|---|---|---|---|---|---|---|---|---|---|---|
| Increase | ✓ | ✓ | ✓ | ✓ | |||||||
| Decrease |
What do you expect the cash rate to be by the end of 2023?
3.7%
Why do you think this?
The forecasts from yield curve models using weekly and monthly rates, as well as those from the models including quarterly inflation, inflation expectations, and labour market conditions, draw a similar picture: the interest rates will keep increasing until mid-2023, reaching the level of 3.5%, with a likely range from 3.1 to 3.9%. The models of quarterly data indicate a sharper increase with higher uncertainty. The year is expected to close with the cash rate at 3.7%. The forecasts are available at https://donotdespair.github.io/cash-rate-survey-forecasts/
By how much do you think the RBA will change the cash rate in the next meeting?
25 basis points
By how much do you think the RBA should change the cash rate in the next meeting?
25 basis points
At what level do you think the cash rate will peak?
3.75%
When do you think the cash rate will peak?
June 2023
RBA’s decision
On 7 February 2023, the RBA announced an increase in the cash rate target by 25 basis points.
Forecasting system
Preparing my answers for this month’s survey, I further expanded my forecasting system. The novelty is two new models for quarterly data downloaded from RBA’s website using an R package readrba. The variables in this new system include the cash rate and CPI inflation, 1-year-ahead inflation expectations based on surveys of professional economists and union leaders, 10-year bond yields, unemployment and employment rates. Therefore, models based on such variables account for the general economic conditions and labour markets. Importantly, they take into consideration inflation and its expectations. The quarterly data spanning the period starting in the second quarter of 2002 and finishing in the last one of 2022 is plotted below.

Based on this data set, two forecasting models were developed using the R package vars: one including all the variables as reported in the plot above, and the other without inflation expectations allowing the series to start in 1995. These limits are dictated by data availability. The two systems of variables were put in Vector Error Correction models with one cointegrating relationship. The resulting forecasts up to one year ahead were pooled and reported above.
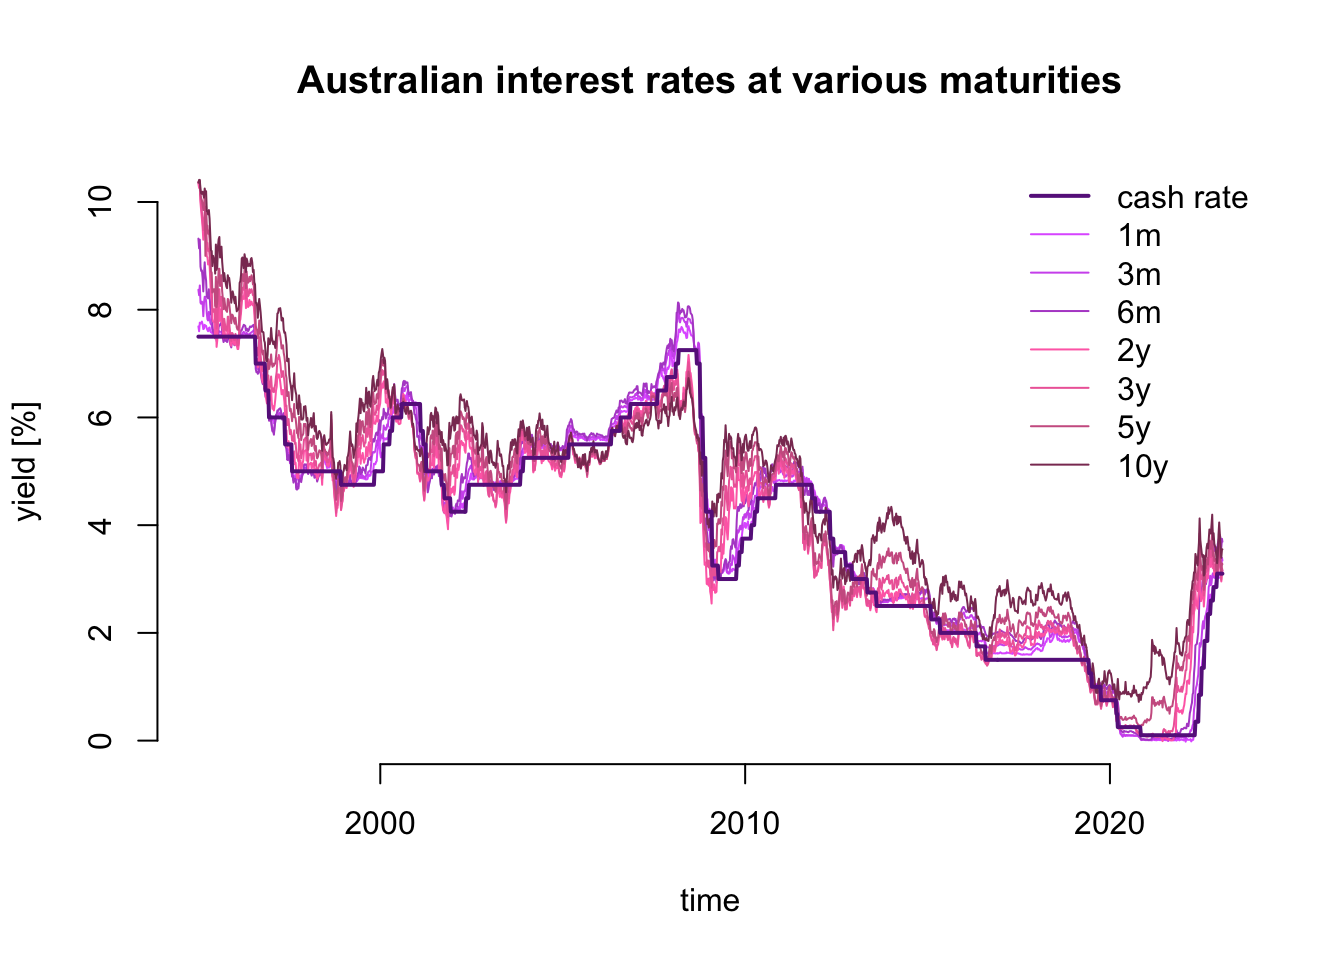
The monthly forecasts were based on the same forecasting system as the one I developed for November forecasts. The updated data is plotted below.