
October 2023
The end-of-October forecasting for the RBA cash rate survey by finder.com.au follows the announcement of September quarterly inflation 5.4%.
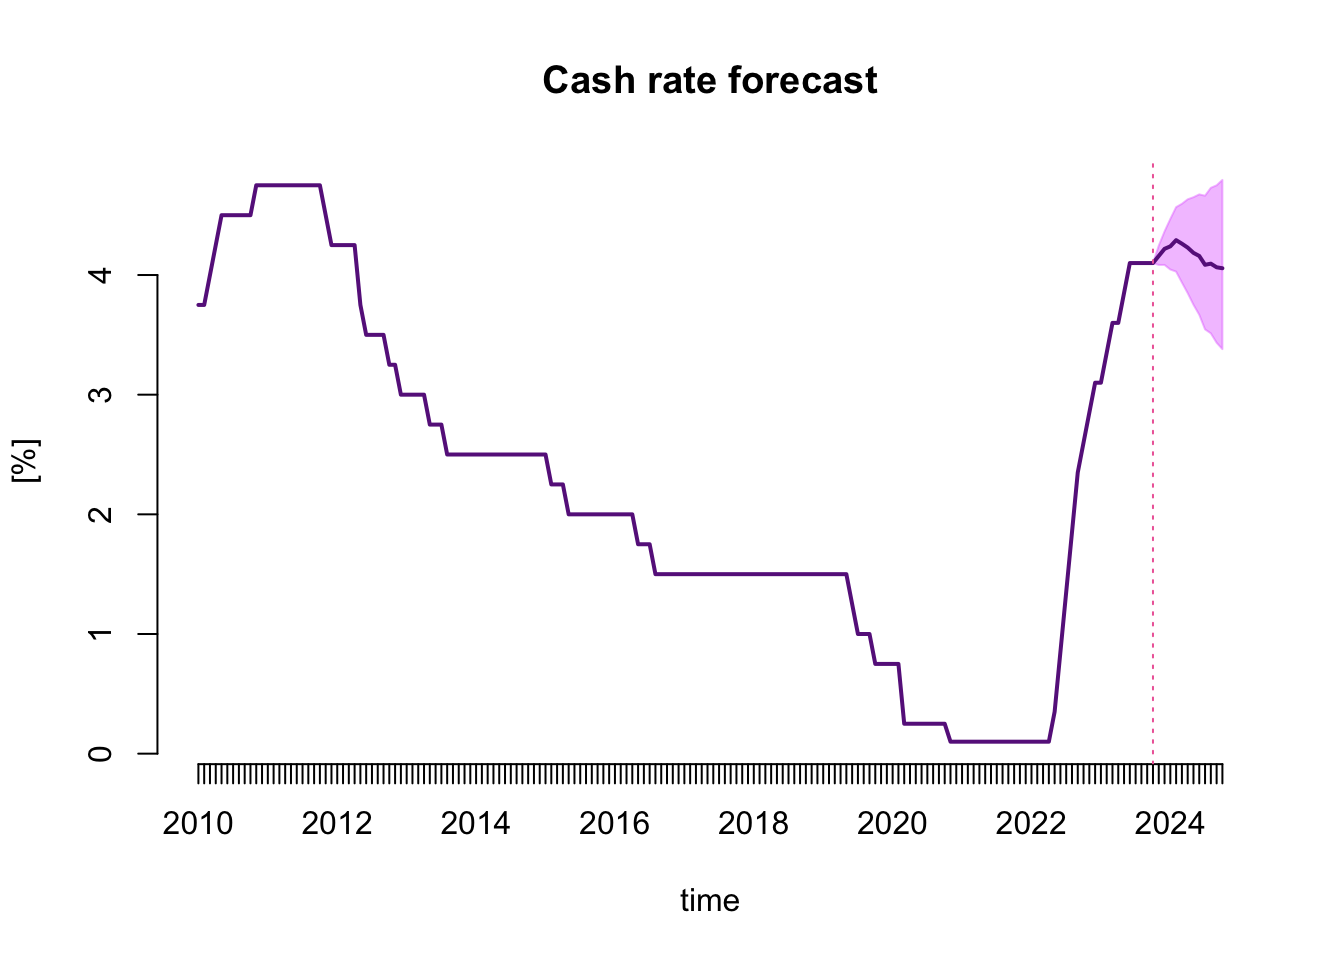
Cash rate forecasts
The figure below presents the monthly cash rate series starting from January 2010, with the forecasts reported from November 2023 to October 2024 as the forecast mean and the 68% forecasting intervals.
The table below makes the numerical values presented in the figure more accessible.
| monthly | lower | upper | |
|---|---|---|---|
| Nov 2023 | 4.16 | 4.08 | 4.25 |
| Dec 2023 | 4.22 | 4.08 | 4.36 |
| Jan 2024 | 4.24 | 4.05 | 4.47 |
| Feb 2024 | 4.29 | 4.03 | 4.57 |
| Mar 2024 | 4.26 | 3.94 | 4.60 |
| Apr 2024 | 4.23 | 3.85 | 4.63 |
| May 2024 | 4.19 | 3.75 | 4.65 |
| Jun 2024 | 4.16 | 3.67 | 4.67 |
| Jul 2024 | 4.09 | 3.55 | 4.66 |
| Aug 2024 | 4.09 | 3.51 | 4.73 |
| Sep 2024 | 4.06 | 3.43 | 4.75 |
| Oct 2024 | 4.06 | 3.38 | 4.79 |
Survey answers
Based on the forecasts above, and the analysis of forecasts from individual models, I formed the following survey answers:
When you think the RBA will change the cash rate?
| Oct 2023 | Nov 2023 | Dec 2023 | Feb 2024 | Mar 2024 | Apr 2024 | May 2024 | Jun 2024 | Jul 2024 or later | |
|---|---|---|---|---|---|---|---|---|---|
| Increase | |||||||||
| Hold | ✓ | ✓ | |||||||
| Decrease |
Why do you think this?
The 68% forecasting interval from my predictive system containing over two hundred models of weekly and monthly data spans the cash rate values from 4.09 to 4.25 per cent. Therefore, it includes both the HOLD and RAISE decisions. Despite the latest reading of quarterly inflation, and given the latest communication from the RBA, my choice is to indicate HOLD. My forecasts are available at: https://forecasting-cash-rate.github.io/
By how much do you think the RBA will change the cash rate in the next meeting?
0 pbs
At what level do you think the cash rate will peak?
4.1%
When do you think the cash rate will peak?
June 2023
RBA’s decision
TBA.
Forecasting system
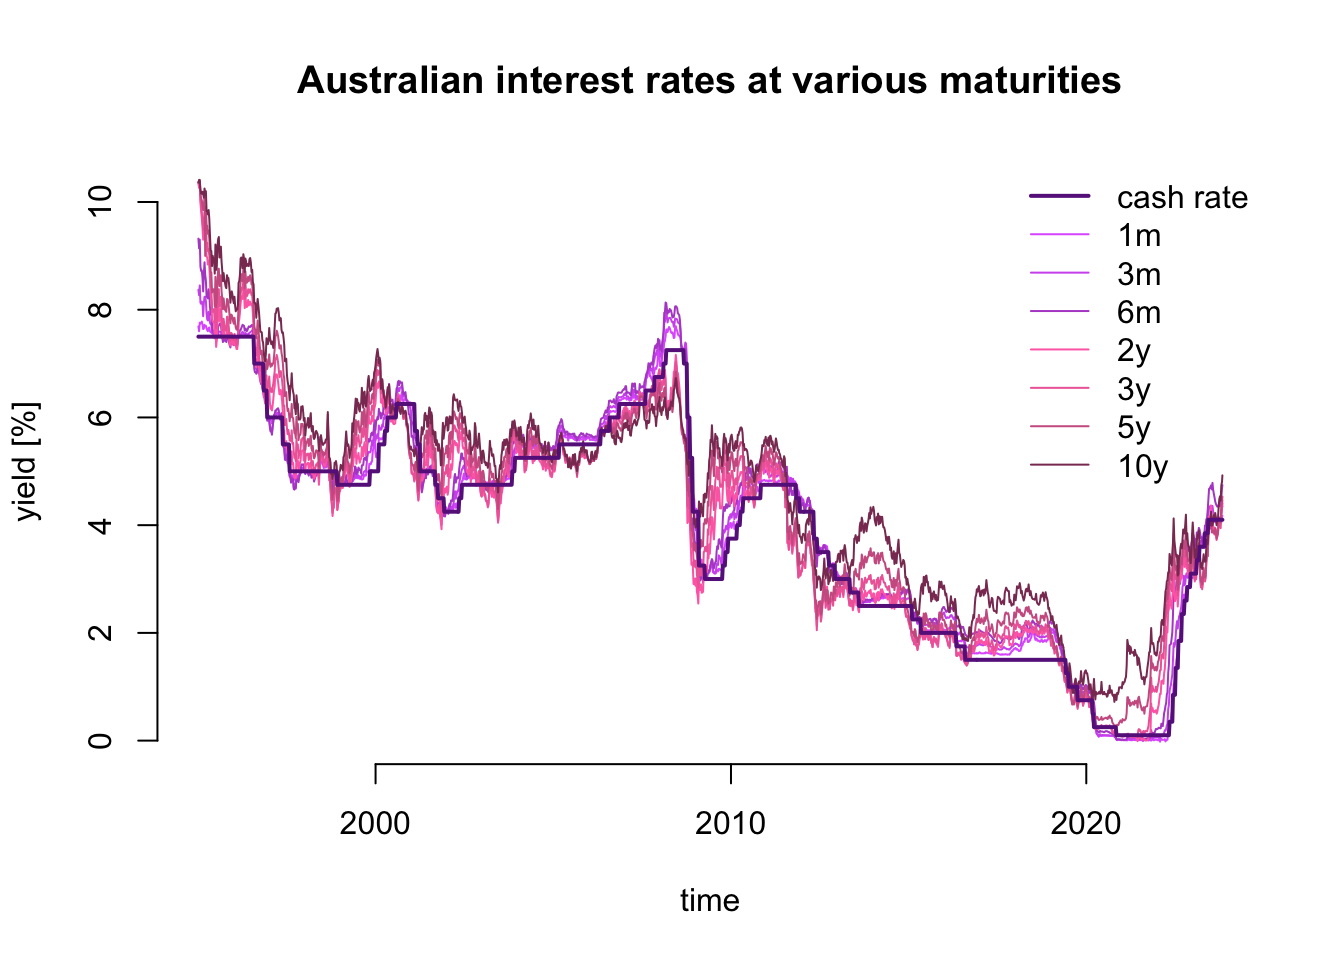
My forecasting system for September is based on the cash rate target and government bond yields at various maturities as presented in the figure below.
The system consists of over two hundred of models. Half of them are are models of weekly and the other half of monthly data.
The novelty starting from this month is forecasting using a foreign sector represented by monthly trade weighted indices and interest rates of Australia’s closest trading partners.
Vector Error Correction models for weekly and monthly series with different model specification parameters. Univariate models for the cash rate capture complex patterns of data persistence using autoregressive moving average equation extended by time-varying volatility equation - a GARCH model. Part of the models include the leverage effect and/or time-varying risk premium.
The forecasts are pooled in two stages. Firstly, the models are weighted in four sub-groups VECM vs. ARMA and weekly vs. monthly data models proportionally to their cash rate forecasting ability. Such four pooled forecasts are equally weighted in the second stage to provide monthly forecasts reported above.