

Early March 2024
Happy New Year! Have a look at my end-of-January forecasts prepared to answer the RBA cash rate survey by finder.com.au.
Cash rate forecasts
The figure below presents the monthly cash rate series starting from January 2010, with the forecasts reported from February 2024 to January 2025 as the forecast mean and the 68% forecasting intervals.
The table below makes the numerical values presented in the figure more accessible.
| monthly | lower | upper | |
|---|---|---|---|
| Mar 2024 | 4.32 | 4.23 | 4.40 |
| Apr 2024 | 4.25 | 4.11 | 4.39 |
| May 2024 | 4.31 | 4.11 | 4.53 |
| Jun 2024 | 4.27 | 4.01 | 4.56 |
| Jul 2024 | 4.32 | 3.98 | 4.67 |
| Aug 2024 | 4.29 | 3.89 | 4.70 |
| Sep 2024 | 4.26 | 3.80 | 4.73 |
| Oct 2024 | 4.22 | 3.70 | 4.75 |
| Nov 2024 | 4.18 | 3.61 | 4.76 |
| Dec 2024 | 4.14 | 3.52 | 4.77 |
| Jan 2025 | 4.14 | 3.46 | 4.81 |
| Feb 2025 | 4.09 | 3.38 | 4.82 |
Survey answers
Based on the forecasts above, and the analysis of forecasts from individual models, I formed the following survey answers:
When you think the RBA will change the cash rate?
| Mar 2024 | Apr 2024 | May 2024 | Jun 2024 | Jul 2024 | Aug 2024 | Sep 2024 | Oct 2024 | Nov 2024 or later | |
|---|---|---|---|---|---|---|---|---|---|
| Increase | |||||||||
| Hold | ✓ | ✓ | |||||||
| Decrease |
Why do you think this?
Yet unlikely! My forecasts using monthly and weekly, domestic and foreign series indicate the beginning of a downward trend in the cash rate. However, the uncertainty around this trend remains large enough to suggest a HOLD decision. For the first in my forecasting exercise term structure of interest rates models for monthly data exclude the hold decision from the forecast interval in favour of a cut. Other groups of models and those for other data balance this effect out in my pooled forecast, though. These forecasts are available at https://forecasting-cash-rate.github.io/
Forecasting system
My forecasting system for November is based on the cash rate target and government bond yields at various maturities as presented in the figure below.
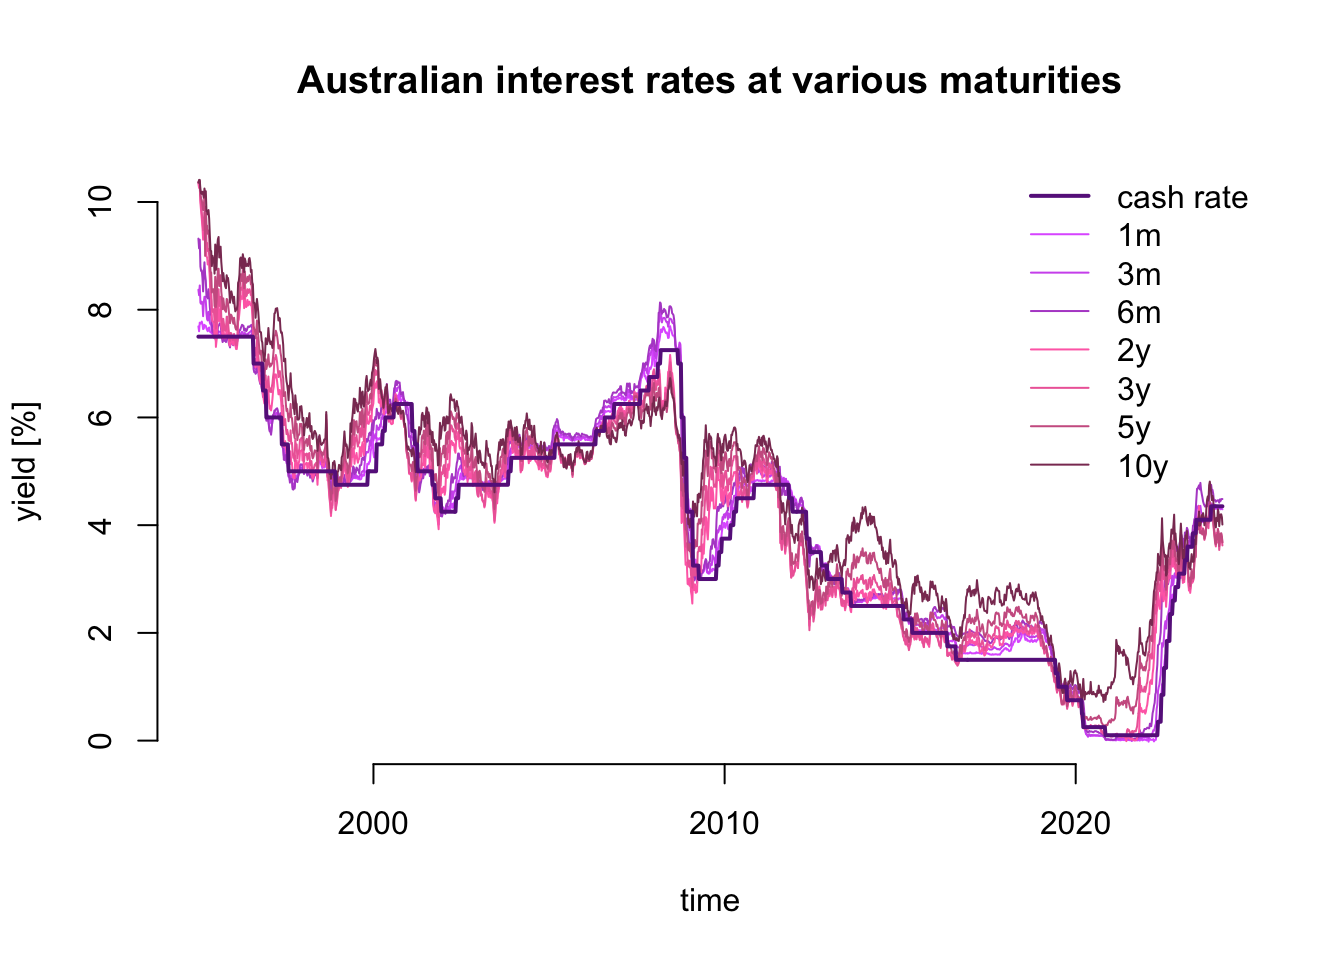
The system consists of over two hundred of models. Half of them are are models of weekly and the other half of monthly data.
Vector Error Correction models for weekly and monthly series with different model specification parameters. Univariate models for the cash rate capture complex patterns of data persistence using autoregressive moving average equation extended by time-varying volatility equation - a GARCH model. Part of the models include the leverage effect and/or time-varying risk premium.
The forecasts are pooled in two stages. Firstly, the models are weighted in four sub-groups VECM vs. ARMA and weekly vs. monthly data models proportionally to their cash rate forecasting ability. Such four pooled forecasts are equally weighted in the second stage to provide monthly forecasts reported above.