
September 2026
Hi! Have a look at my forecasts prepared to answer the RBA cash rate survey by finder.com.au.
Cash rate forecasts
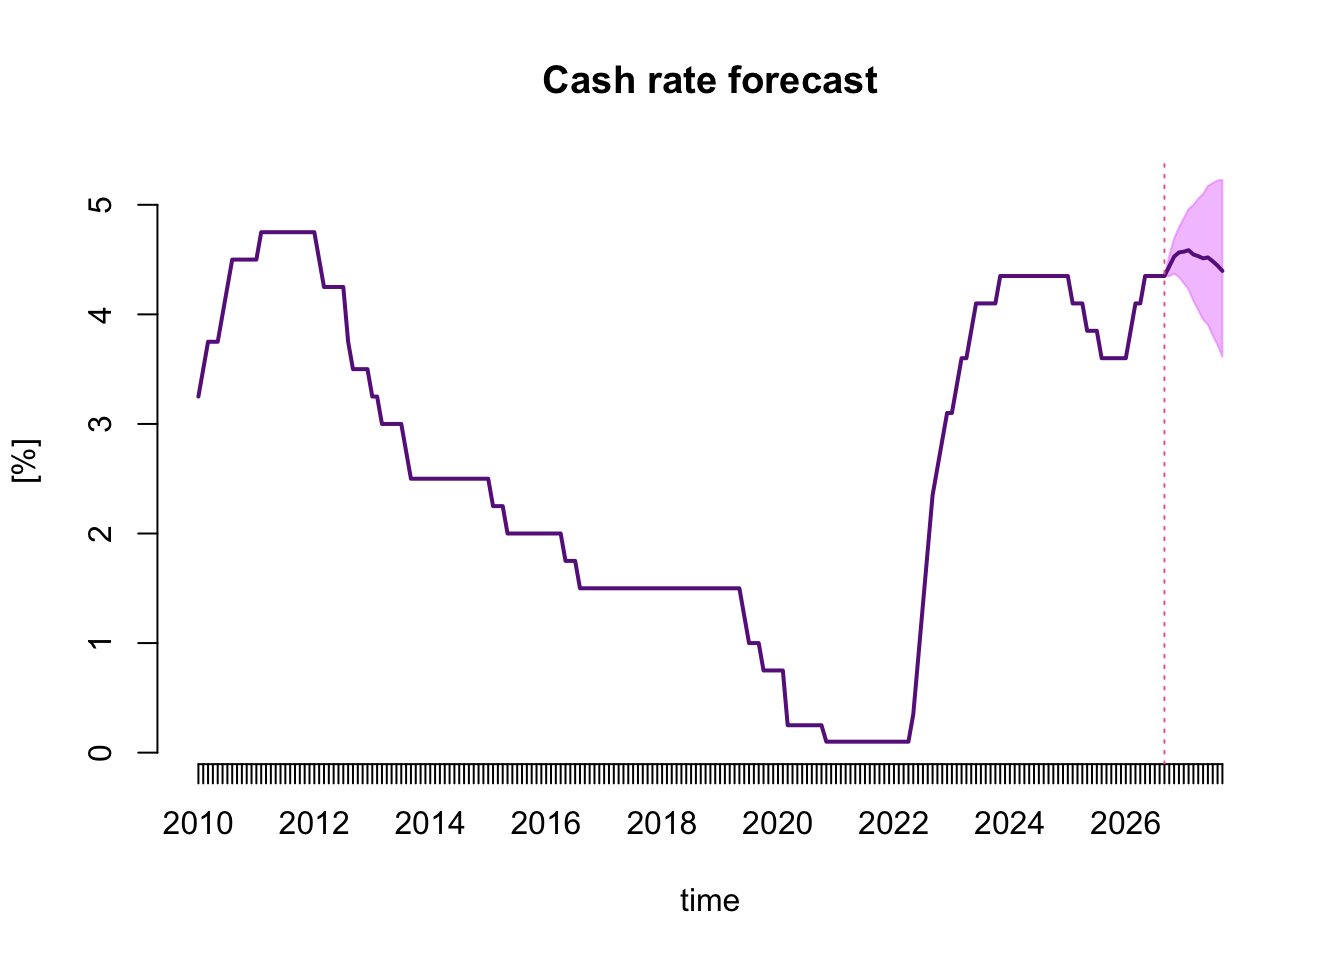
The figure below presents the monthly cash rate series starting from January 2010, with the forecasts for another year reported as the forecast mean and the 68% forecasting intervals.
The table below makes the numerical values presented in the figure more accessible.
| monthly | lower | upper | |
|---|---|---|---|
| Oct 2026 | 4.44 | 4.35 | 4.54 |
| Nov 2026 | 4.53 | 4.37 | 4.69 |
| Dec 2026 | 4.56 | 4.34 | 4.79 |
| Jan 2027 | 4.57 | 4.28 | 4.88 |
| Feb 2027 | 4.59 | 4.23 | 4.96 |
| Mar 2027 | 4.55 | 4.12 | 5.00 |
| Apr 2027 | 4.53 | 4.04 | 5.06 |
| May 2027 | 4.51 | 3.95 | 5.10 |
| Jun 2027 | 4.52 | 3.90 | 5.17 |
| Jul 2027 | 4.48 | 3.81 | 5.20 |
| Aug 2027 | 4.44 | 3.72 | 5.22 |
| Sep 2027 | 4.40 | 3.61 | 5.23 |
Survey answers
Based on the forecasts above, and the analysis of forecasts from individual models, I formed the following survey answers:
When you think the RBA will change the cash rate?
| Sep 2025 | Oct 2025 | Dec 2025 | Feb 2026 | Mar 2026 | Apr 2026 | May 2026 | July 2026 | Aug 2025 or beyond | |
|---|---|---|---|---|---|---|---|---|---|
| Increase | ✓ | ||||||||
| Hold | |||||||||
| Decrease |
Why do you think this?
It’s a likely RAISE! My forecasting system indicates an 82 percent probability of such an outcome. All the bond yield curve models say so, but not those that rely on international rates or cash rate dynamics alone. A rate hike seems in line with the RBA’s recent communication, the cash rate staying above the target and inflationary pressures. My forecasts are available at: https://forecasting-cash-rate.github.io/